
Find what your dashboards miss.

We build agents that autonomously investigate company data to uncover risks, opportunities, and unexpected connections, while showing the evidence behind every finding.

Get a 15-minute demo
Rover in one minute

Trusted across data, operations, and applied AI teams

CobaltoNTT DATAMiraitekSmart RebirthBrand to CommerceDastyDastyFlySimBowman ConsultingNVIDIA Inception Program
ChatVSAgents

You don't need to know what to ask.

In conversational business intelligence, every analysis begins with a question. You need to know what to ask, write the right prompt, and continue the conversation for every new hypothesis. Our agents start with the data instead. They formulate questions, test hypotheses, and autonomously follow the most promising signals, surfacing what no one had thought to look for.

Conversational BI
One question at a time
You
Why did returns increase?
BI
Which period should I analyze?
You
The last quarter.
BI
Which sales channel should I focus on?
The analysis waits for the next prompt.
Autonomous investigation
Agents pursue the signal
Rover · Path 1
Which items tie up capital without generating turnover?
I’m running a Pareto analysis across inventory value and turnover.
Class X concentrates most of the value in items below median turnover.
Rover · Path 2
Does the concentration repeat across warehouses?
I’m building a heatmap across locations, items, and days in inventory.
The same item groups surface in two locations.
Rover · Path 3
Do inventory changes actually follow sales?
I’m correlating inventory, sales, and replenishment over time.
Inventory rises before demand. I’m investigating orders and lead times.
Each piece of evidence autonomously generates the next question.
Reproducible by design

AI chooses where to look. Code computes the result.

Rover uses AI to choose what to investigate, not to invent results. SQL queries and Python calculations run in isolated sandboxes. Source data, steps, and checks stay connected, so every result can be reproduced and verified.

Queries that check one another
Three paths, one source of truth
SQL
Path 1

I define the perimeter using the latest valid record for each item.

WITH ranked AS (
  SELECT *, ROW_NUMBER() OVER (PARTITION BY item_id ORDER BY recorded_at DESC) AS rn
  FROM inventory
) SELECT * FROM ranked WHERE rn = 1;

I attach the item class to the latest inventory snapshot.

SELECT i.item_id, i.stock_value, m.item_class
FROM latest_inventory i
JOIN item_master m USING (item_id)
WHERE i.stock_value > 0;

I add supplier lead times without discarding unmatched items.

SELECT i.item_id, s.lead_days
FROM latest_inventory i
LEFT JOIN suppliers s ON s.supplier_id = i.supplier_id
WHERE COALESCE(s.active, TRUE);
Path 2

I check duplicates and missing values before comparing groups.

SELECT COUNT(*) AS rows, COUNT(DISTINCT item_id) AS items,
SUM(CASE WHEN stock_value IS NULL THEN 1 ELSE 0 END) AS missing
FROM latest_inventory;

I compare inventory coverage with the last 90 days of sales.

SELECT i.item_id, i.on_hand, SUM(s.quantity) AS sold_90d
FROM latest_inventory i
JOIN sales s ON s.item_id = i.item_id
GROUP BY i.item_id, i.on_hand;

I verify whether open replenishments explain the excess stock.

SELECT i.item_id, SUM(r.open_quantity) AS inbound
FROM latest_inventory i
LEFT JOIN replenishments r ON r.item_id = i.item_id
GROUP BY i.item_id;
Path 3

I test whether Class X remains an outlier after normalizing turnover.

SELECT item_class, AVG(stock_value / NULLIF(turnover, 0)) AS score
FROM latest_inventory
GROUP BY item_class;

I connect normalized inventory scores to realized demand.

SELECT i.item_class, AVG(i.stock_value / NULLIF(s.sold_90d, 0)) AS score
FROM latest_inventory i
JOIN sales_90d s USING (item_id)
GROUP BY i.item_class;

I isolate locations whose score remains above their target.

SELECT i.location_id, AVG(i.stock_value / NULLIF(i.turnover, 0)) AS score
FROM latest_inventory i
JOIN location_targets t USING (location_id)
GROUP BY i.location_id, t.max_score
HAVING AVG(i.stock_value / NULLIF(i.turnover, 0)) > t.max_score;
The queries narrow the field before calculations begin.
Secure sandbox
A temporary environment runs and verifies each calculation
Starting environment...
sandbox / isolated-run
Every run preserves its source snapshot, code, and output.

Meet Rover.

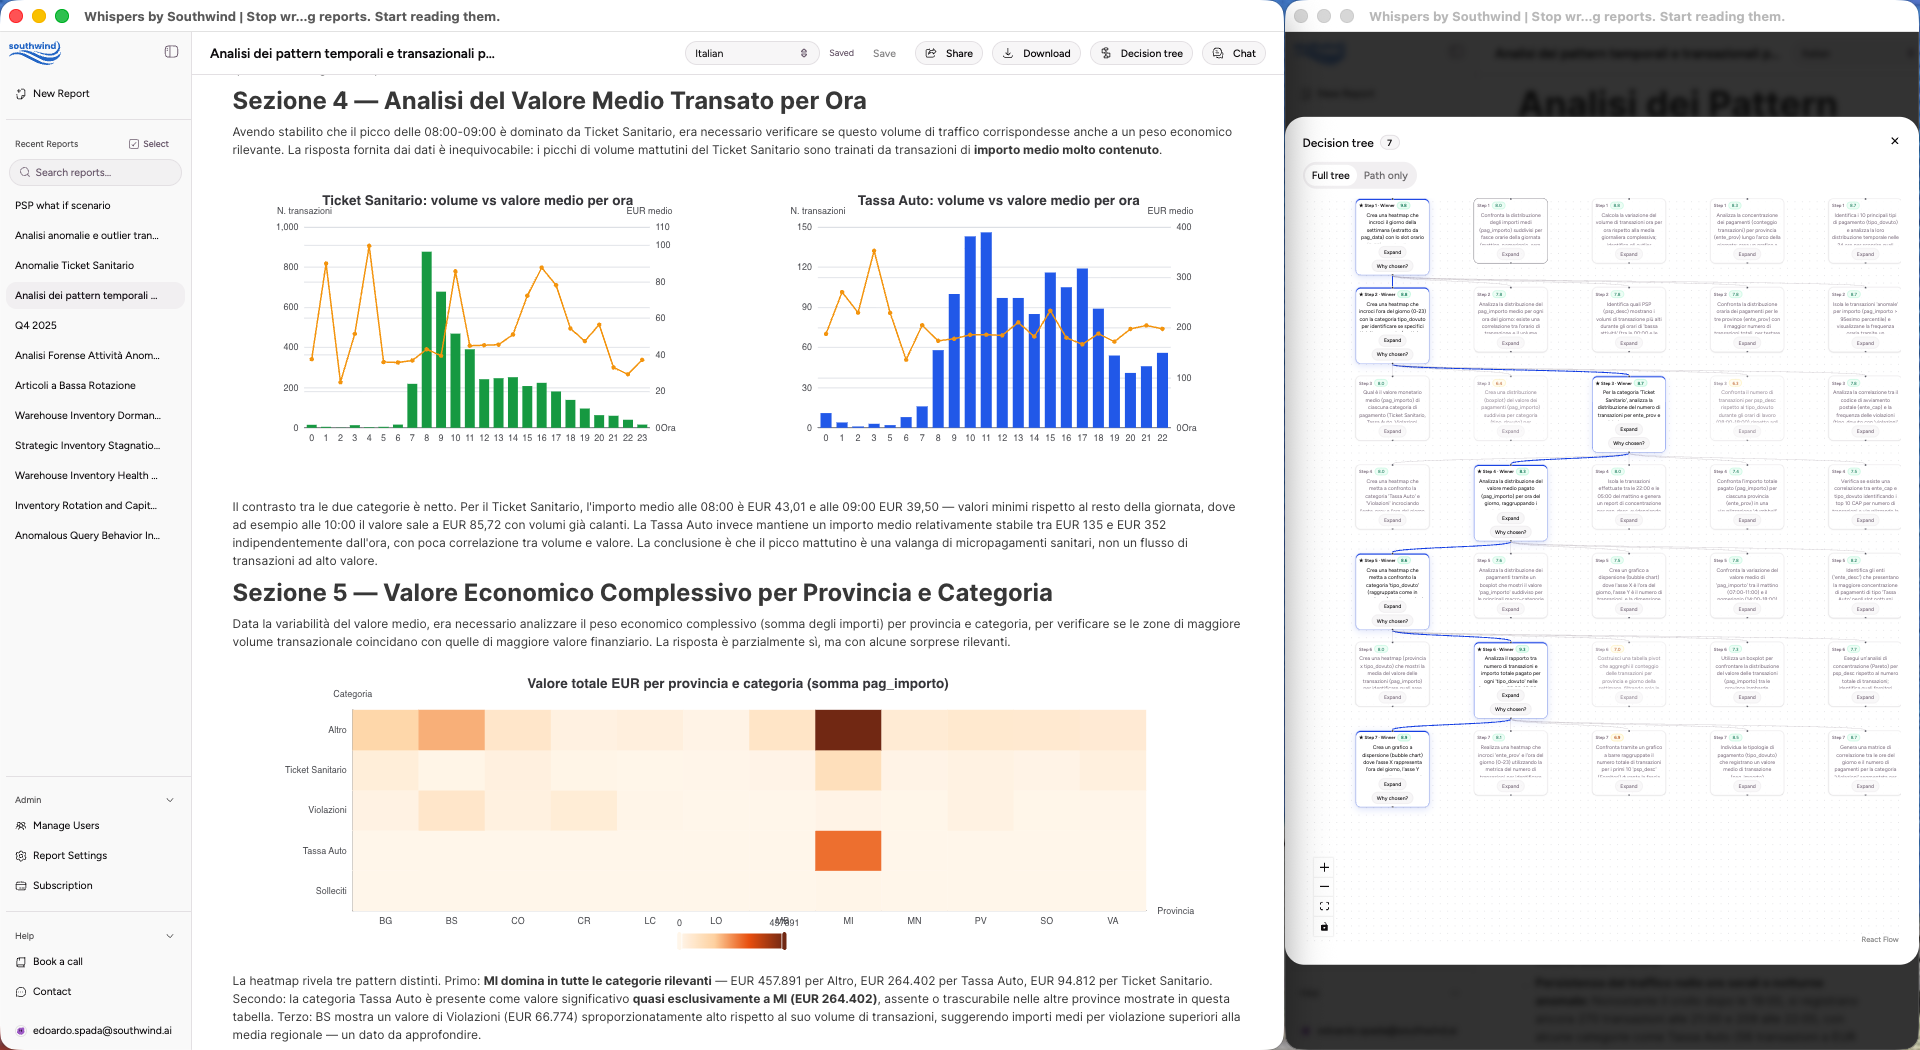
Rover is our first agent. It explores data through weighted decision trees: at every step, it evaluates the available signals, scores the possible directions, and follows the most promising path. Results and feedback from each run refine the investigations that follow, while scoring adapts to each organization’s operating context: priorities, rules, and definitions of value.

Two ways to get started.

Use the web app to upload a file, connect a source, and start an investigation immediately. Or integrate our agents into your products and workflows through the API.

Explore the API documentation
Signals

What we learn building agents that investigate on their own.

5 articles
Warehouse case study cover

Case study: hidden signals in a warehouse

Jun 16, 2026 · 7 min read
Case study

One public warehouse dataset. Seven investigative branches. Five operational risks that only made sense together.
Data problems do not respect org charts cover

Data problems do not respect org charts

Jun 09, 2026 · 2 min read
Essay

Companies divide ownership by team. Data moves through relationships. The expensive problems appear in between.

Non-determinism is not a bug cover

Non-determinism is not a bug

May 20, 2026 · 2 min read
Essay

Exploration is not noise. It is how an autonomous system finds the path nobody predefined.
From monitoring to understanding cover

From monitoring to understanding

May 12, 2026 · 2 min read
Essay

A shift from reactive monitoring to systems that investigate every hypothesis in the background, at the speed data changes.

The perimeter problem cover

The perimeter problem

Apr 13, 2026 · 3 min read
Essay

Every dashboard draws a boundary around what gets seen. The risk is everything useful that falls outside it.