
This case study starts from a public warehouse logistics dataset and shows the full Rover report generated by Whispers.
The input was intentionally ordinary: inventory levels, reorder points, lead times, demand forecasts, fulfillment rates, picking time, unit economics, and layout scores. The useful part is not the table itself, but the path Rover chose through it.
One point is worth making explicit: this is a vanilla Rover run. The system received no dataset description, no extra operational context, and no manual guidance on what to look for.
Dataset sourceKaggle Logistics Warehouse Dataset↗Dataset profile
Kaggle Logistics Warehouse Dataset
- 3,204
- rows
- 23
- columns
- 73,692
- data points
- 5
- categories
| item_id | category | stock_level | reorder_point | reorder_frequency_days | lead_time_days | daily_demand | demand_std_dev | item_popularity_score | storage_location_id | zone | picking_time_seconds | handling_cost_per_unit | unit_price | holding_cost_per_unit_day | stockout_count_last_month | order_fulfillment_rate | total_orders_last_month | turnover_ratio | layout_efficiency_score | last_restock_date | forecasted_demand_next_7d | KPI_score |
|---|---|---|---|---|---|---|---|---|---|---|---|---|---|---|---|---|---|---|---|---|---|---|
| ITM10000 | Pharma | 283 | 21 | 4 | 4 | 49.85 | 1.56 | 0.43 | L82 | B | 106 | 3.61 | 117.8 | 1.14 | 0 | 0.8 | 700 | 3.33 | 0.33 | 2024-02-17 | 184.37 | 0.556 |
| ITM10001 | Automotive | 301 | 52 | 9 | 6 | 23.34 | 2.55 | 0.69 | L15 | A | 45 | 3.54 | 178.8 | 1.09 | 3 | 0.79 | 736 | 10.36 | 0.98 | 2024-10-01 | 221.94 | 0.723 |
| ITM10002 | Groceries | 132 | 60 | 11 | 8 | 37.69 | 3.15 | 0.62 | L4 | B | 177 | 0.52 | 54.05 | 0.95 | 7 | 0.75 | 814 | 14.32 | 0.87 | 2024-04-07 | 53.85 | 0.68 |
| ITM10003 | Automotive | 346 | 46 | 13 | 5 | 33.69 | 2.79 | 0.21 | L95 | A | 39 | 2.64 | 31.1 | 1.9 | 0 | 0.96 | 994 | 2.08 | 0.29 | 2024-01-27 | 92.04 | 0.488 |
| ITM10004 | Automotive | 49 | 55 | 4 | 6 | 49.58 | 5.23 | 0.31 | L36 | D | 35 | 1.4 | 104.97 | 0.63 | 5 | 0.83 | 299 | 5.65 | 0.96 | 2024-05-17 | 194.58 | 0.67 |
Rover did not receive a handcrafted dashboard. It explored the data, proposed candidate analyses, scored them, selected the strongest branch, and used each result to decide the next question. The decision tree is the product: it shows how the analysis moved from stockout risk to capital allocation.
Inventory Optimization Analysis: Stockout Risk and Reorder Priorities
This investigation was conducted to assess the operational and financial stability of inventory, starting from the need to qualify stockout risk by comparing current levels with projected demand. The analysis evolved naturally from a reactive perspective (identifying critical issues) toward a more structural approach, exploring the logistics causes and financial inefficiencies that affect customer service.
The investigative path unfolded across seven complementary steps:
Calculating the risk ratio (forecasted_demand_next_7d / stock_level) for high-turnover items
Correlation between layout efficiency and critical items
Cost-inefficiency matrix (holding_cost vs order_fulfillment_rate)
Multi-dimensional visualization of economic criticalities
Comparative KPI analysis by category with outlier detection
Concentration of trapped capital (Pareto analysis)
Operational prioritization of projected understocked items
Stockout Risk Analysis
The first stage identified the items with the highest ratio between forecast demand over the next 7 days and available stock, focusing on those with high turnover_ratio (>=14.75). This approach isolated 21 critical items with risk ratios ranging from 0.386 to 8.22.
The most critical items include ITM10388 (Electronics) with a risk_ratio of 8.22, ITM10024 (Electronics) at 3.89, and ITM10878 (Automotive) at 3.85. The category distribution shows a prevalence of Automotive items (6) and Electronics items (5) among the riskiest cases.
The chart cannot be displayed right now.
The extreme volatility of some items, with ratios above 3, highlights the need for an immediate review of reorder points. The correlation between item_popularity_score and stockout_count_last_month is statistically insignificant (-0.0006), suggesting that supply issues are not directly correlated with item popularity.
Layout Efficiency and Operational Impact
After identifying the 20 highest-risk items, the next step was to verify whether the inefficiencies were driven by physical placement issues. Comparing the layout_efficiency_score of these critical items against the global average of 0.605 revealed interesting patterns.
The chart cannot be displayed right now.
The analysis reveals a heterogeneous distribution: while some critical items such as ITM10776 and ITM10205 show excellent layout_efficiency_score values (0.96), others such as ITM10602 (0.29) and ITM10804 (0.52) show severe placement inefficiencies. 45% of at-risk items have an efficiency below the global average, suggesting that physical layout contributes significantly to stockout problems.
Cost-Inefficiency Matrix
The analysis then focused on the 15 items with the highest daily holding costs (holding_cost_per_unit_day) that also show an order_fulfillment_rate below the average of 0.85. This matrix highlights where capital is being tied up without ensuring an adequate service level.
The chart cannot be displayed right now.
The concentration in the lower-right quadrant (high cost, low fulfillment) confirms working-capital inefficiency. Electronics items dominate this critical zone with 4 of 15 positions, followed by Groceries (4) and other sectors.
The most problematic item is ITM10517 (Automotive) with a holding_cost of 1.98 EUR/day and a fulfillment rate of 73%, representing an emblematic case of inefficiently allocated capital.
KPI Analysis by Category
The comparative analysis of KPI_score by category revealed significant differences in operating performance. The overall distribution has a mean of 0.60 with a standard deviation of 0.11, showing moderate variability across items.
The chart cannot be displayed right now.
The analysis identified 6 significant outliers (0.19% of the dataset): ITM10558 (Electronics, 0.924) and ITM13152 (Groceries, 0.936) represent exceptional performance, while ITM10063 (Apparel, 0.273), ITM10517 (Automotive, 0.265), ITM10936 (Electronics, 0.259), and ITM12248 (Electronics, 0.279) show severe criticalities.
The Electronics category shows the greatest dispersion (std: 0.116), with the widest range between excellent and critical performance, indicating deep internal operational instability that requires targeted structural intervention.
Concentration of Trapped Capital
The analysis of total inventory value (stock_level × unit_price) revealed a significant concentration of capital. Total value amounts to 27.21 million EUR, distributed across categories with Pharma leading (6.10M EUR), followed by Electronics (5.71M EUR) and Apparel (5.40M EUR).
The chart cannot be displayed right now.
The top 10 items account for 3.42% of total inventory value, with ITM10195 (Groceries) alone worth 97,575 EUR. This strong concentration of value highlights the critical importance of closely monitoring these high-impact assets for risk-management decisions.
Operational Reorder Priorities
The final analysis identified the items that require immediate reordering: those with high forecasted_demand_next_7d and stock_level below the reorder_point. 87 items were identified in this critical condition, spread across all categories.
The chart cannot be displayed right now.
The Automotive category dominates the list with 25 critical items and an average projected demand of 153.6 units over the next 7 days. ITM10743 is the most urgent case, with projected demand of 299.94 units but only 44 units in stock against a reorder_point of 99.
Conclusions and Recommendations
The investigation revealed that stockout risk does not depend exclusively on demand, but stems from a complex mix of factors: inadequate physical layout efficiency (especially for the Electronics category), capital tied up in slow-moving items, and suboptimal reorder policies.
Key findings include:
21 high-turnover items show critical stockout risk, with 8 cases above a risk_ratio of 1.5
45% of critical items have a layout_efficiency_score below the global average
15 items combine high holding costs (>1.93 EUR/day) with low fulfillment rate (<0.85)
The top 10 items by value absorb 3.42% of total capital (927,434 EUR out of 27.21M EUR)
87 items require immediate reordering, with Automotive carrying the heaviest load
Recommended priority actions are:
Immediately reorganize the physical placement of critical items with layout_efficiency_score <0.60
Review stock levels for the 10 high-value Pareto items to optimize capital allocation
Execute the priority reorder plan for the 87 identified items, focusing first on the top 20 by urgency
Implement systematic monitoring that integrates holding costs into daily replenishment decisions
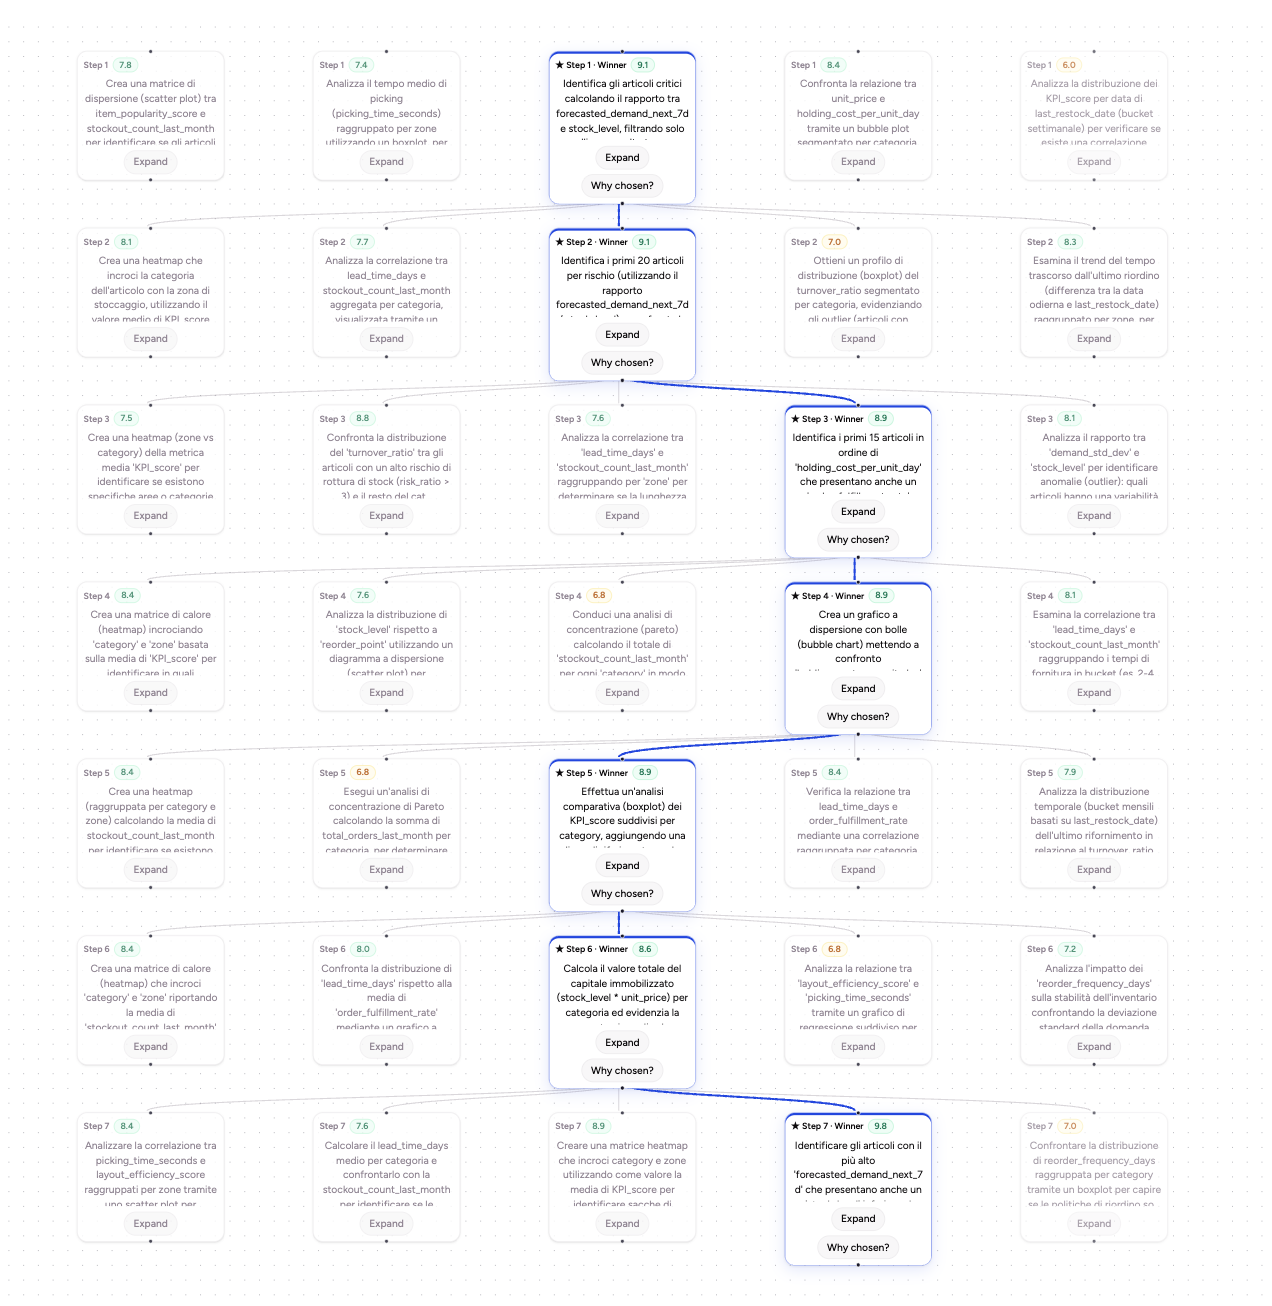
Before going step by step, it helps to see the full map once. Below we unpack each winning branch and show what happened behind the scenes, from candidate generation to score selection, making the logic of each decision visible.
Inventory Optimization Analysis: Stockout Risk and Reorder Priorities
- 01
Stockout Risk Analysis
- 02
Layout Efficiency and Operational Impact
- 03
Cost-Inefficiency Matrix
- 04
KPI Analysis by Category
- 05
Concentration of Trapped Capital
- 06
Operational Reorder Priorities
- 07
Conclusions and Recommendations